My interest in data analysis was sparked in 2022 when I discovered its important role in medical research. I realized that data analysis could provide solutions to real-world problems, guide decision-making, and enhance the quality of healthcare. This field not only aligned with these goals but also with my broader interests in entrepreneurship, sales, and marketing, making it the perfect entry point into the tech industry.
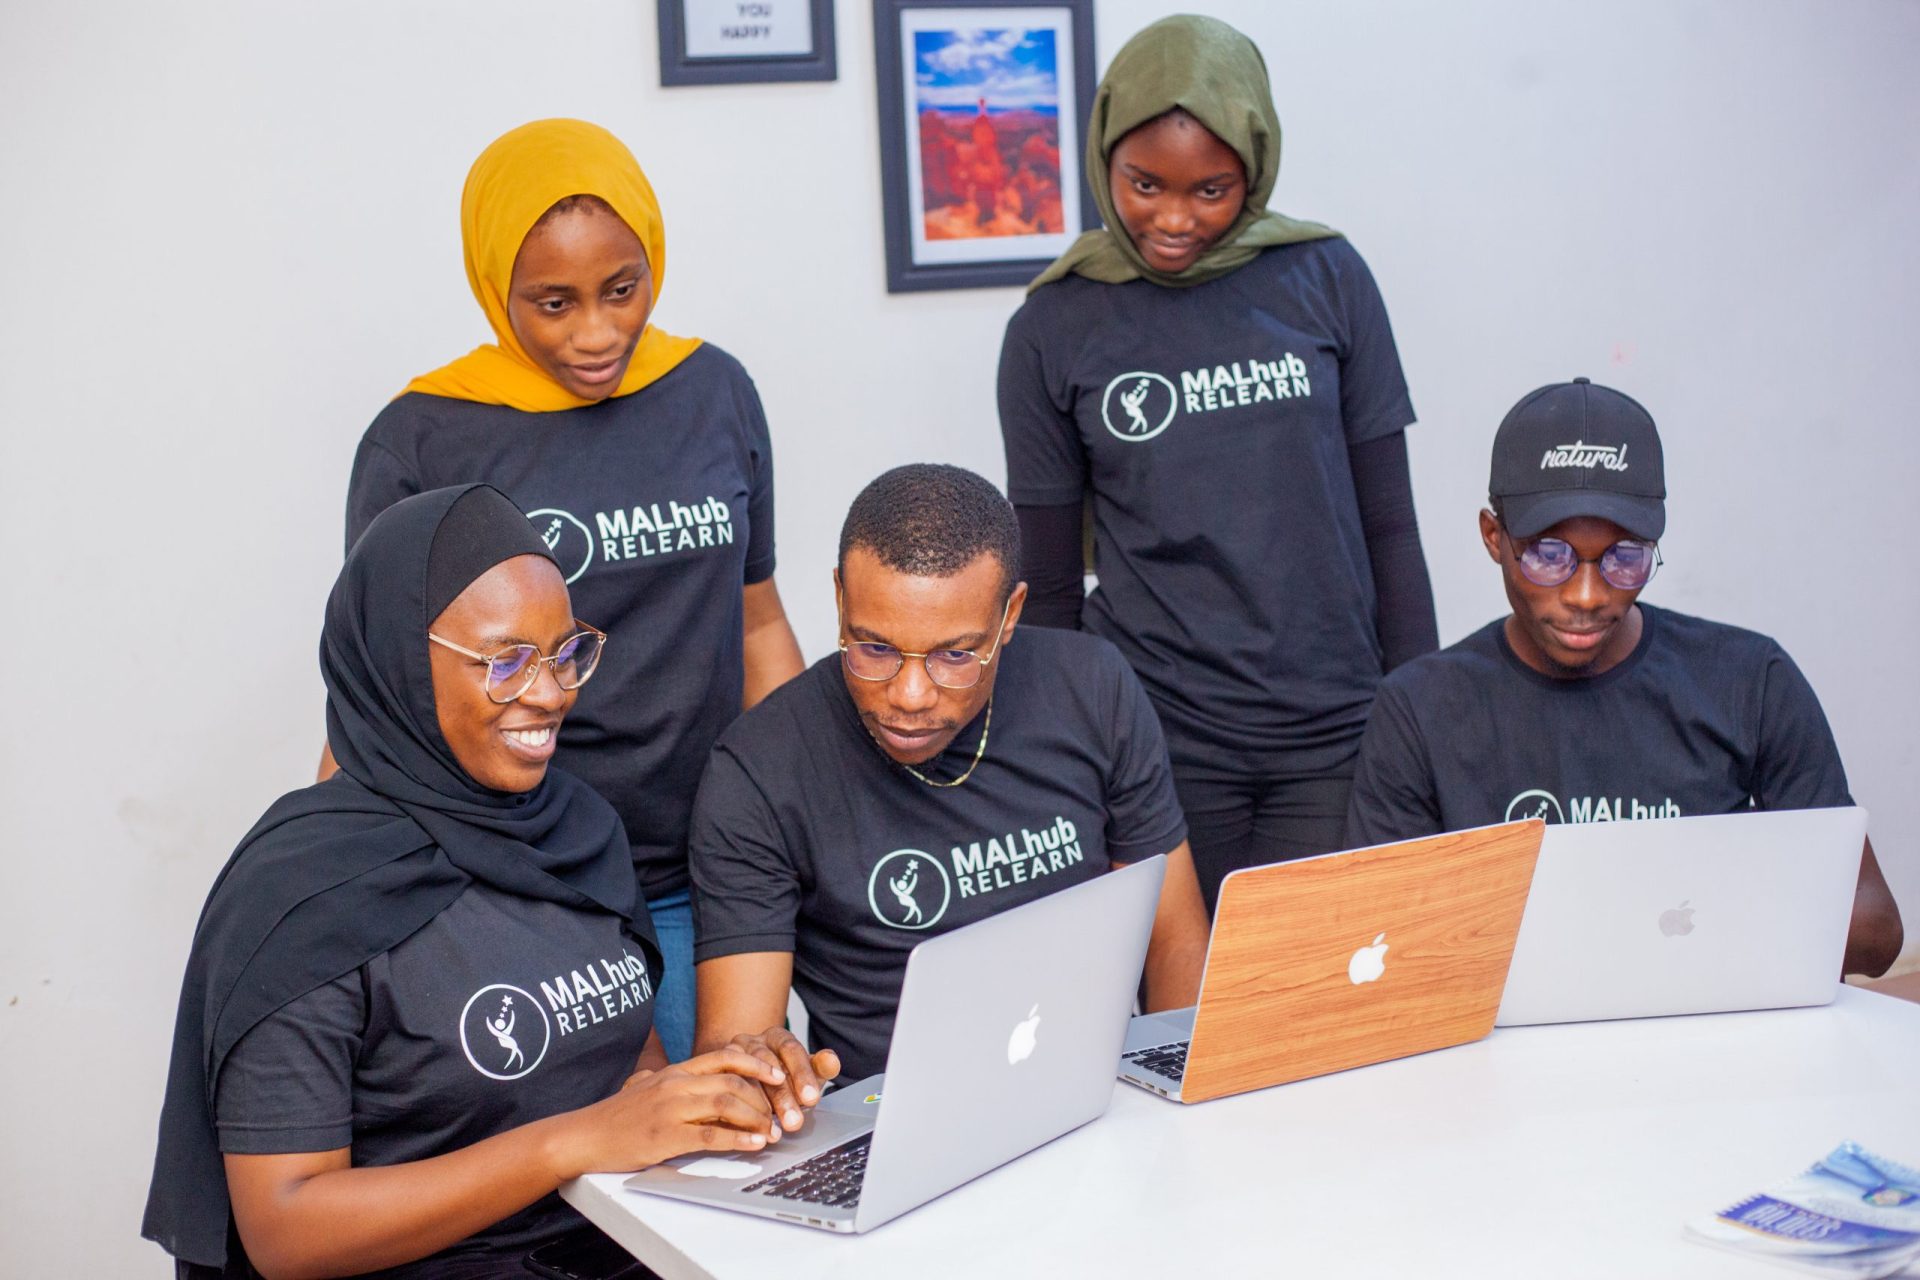
I officially started my journey in July this year, 2024, when I finally got a longer break from school. I reached out to MALhub after reading about their organization, tech courses and positive reviews about their training services. Their data analysis course outline includes learning all the tools I had planned in my road map – Excel, Structured Query Language (SQL), Power BI and Python. It was the perfect fit for me.
I reached out to MALhub on Instagram, and their representative responded swiftly, providing all the details I needed to sign up. Shortly after, I received an onboarding email that included the course outline, which was set to run for about three months across five phases—one for each data analysis tool and a final phase for project building. The email also included software installation manuals and links to join a community of like-minded individuals. With all the information I needed, gadgets and tools installed, I began my training.
The First Phase — Learning Excel
For the first session of this phase, the tutor gave us an overview of this tool which includes how the interface of the software looks like- the ribbon, workbooks, sheets, rows, columns, etc. At the end of it, I was mind blown by how powerful and multifunctional it was. Prior to that session, I had only used it for record keeping and sales tracking.
Over the next 3 weeks of which Excel was covered, I learnt how to use this tool to carry out multiply functions such as arithmetic calculations (SUM, AVERAGE, COUNT etc.) , data entry ethics, data cleaning and transformation to derive solutions.
I also learnt how to clean and transform data on Excel power query editor and how to visualize data. The tutor explained the importance of visualizing data in simpler form to understand by others and the best types of charts to do so for various types of data.
To encourage and further strengthen our grasp of what we were being taught, we were assigned multiple excel tasks. Each of which, I found interesting, mind indulging and helped me improve my problem solving skills. I especially like that they were examples of real life data set and problems.
As they say, “practice makes perfect”. When I could, I continued to practice with the data samples given to us, watched the replay videos of each session and always asked questions in the class group whenever I needed more explanation.
For insights on career growth, check out The Importance of Networking Events for Career Growth.
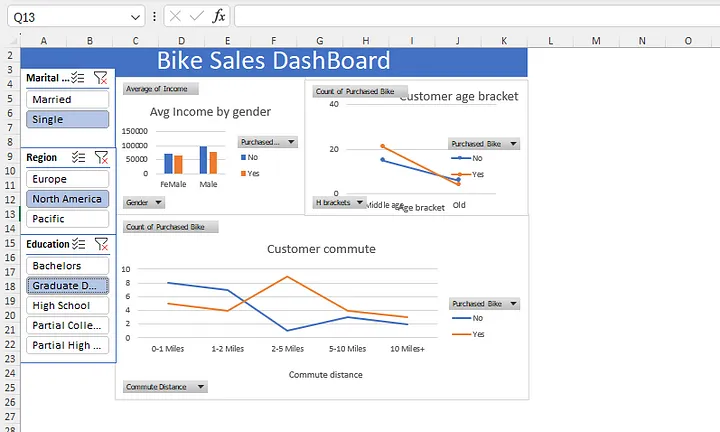
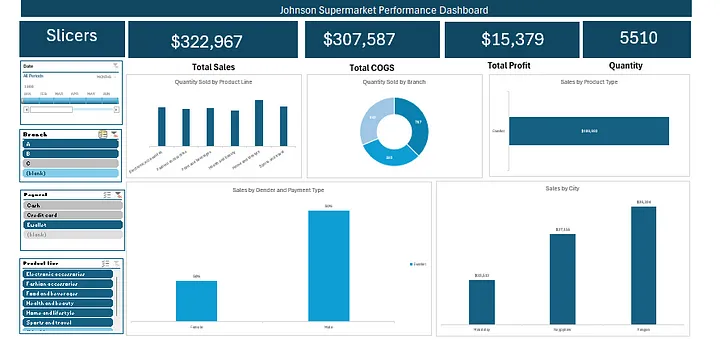
The Excel phase came to an end with the final task, which I must say, was my favorite- building an interactive dashboard. After watching the replay videos of how to successfully build one, I worked with the data sets given and made a replica of what was asked of us. I was genuinely happy that I had worked on it on my own and I could appreciate the importance of it.
The Second Phase- Learning Structured Query Language (SQL)
With the conclusion of Excel, we dove into SQL. I must say, this tool took me quite some time to handle, but as always, our tutor was available to provide further explanation and resources to understand it better.
We had various sessions, the first of which I was introduced to this tool as a powerful database management system for data extraction, manipulation and definition. I came to know of primary key, foreign key, tables, schemas etc.
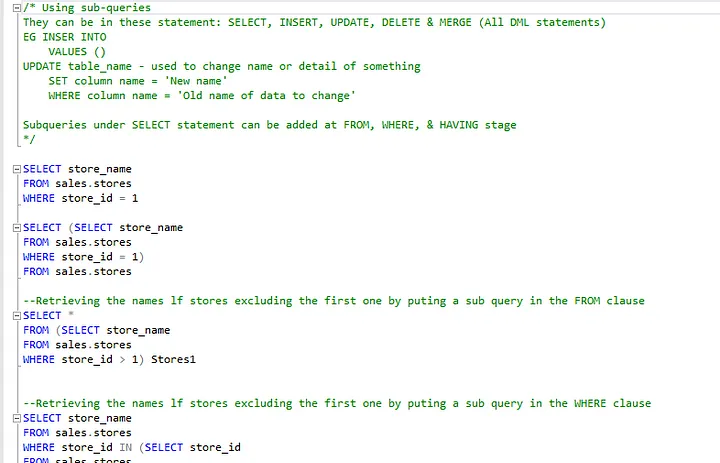
I learnt how to use various data manipulation statements such as SELECT, INSERT, UPDATE, DELETE & MERGE and data definition statements such as CREATE, ALTER, DROP, RENAME etc.
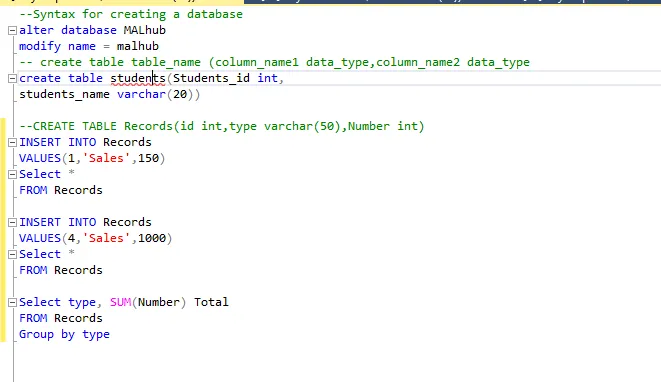
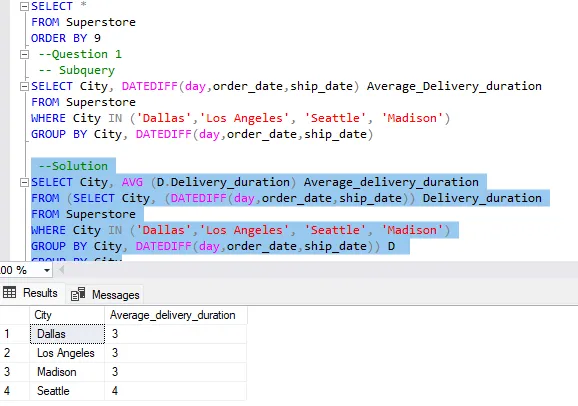
In no time I was able to create queries and subqueries, join tables, segregate data by grouping, and filter data to extract the needed information.
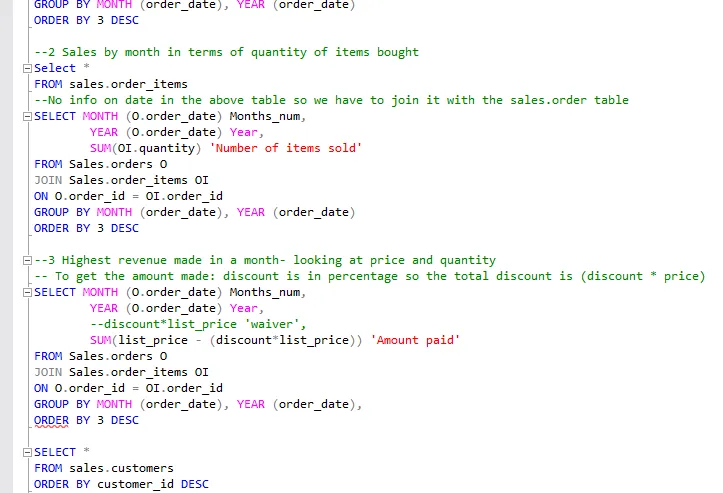
Just like Microsoft Excel, we were given multiple SQL tasks to test our capacity to work with the tool. In the final task, I used the data given to write queries and help a hypothetical company derive information about their customers and sales.
The Third Phase- Learning Microsoft Power BI
This is the phase we are currently in. Power BI, just like SQL, was entirely new to me. I got to know that it is a powerful data visualization tool made by Microsoft and can handle more complex visualization than Excel. Although its interface has some similarities to Excel, it is entirely different with its functions more specific to chart creation and dashboard building.
So far, I have learnt how to connect data to the app and use its power query editor to transform and load data. I can work my way round the various function on the interface and view relationship between tables in multiple format (table, model)
Learning Power BI has been slower than I hoped but with each session I am definitely getting better at it and with the structure set by MALhub, I am able to learn at my own pace and still catch up with the rest of the class.
More of which is left for me to learn on Power BI includes; Power BI data Modelling and DAX, Data visualization (Report, dashboard, inserting charts and visuals, filtering options, editing report interactions, drill through filters etc).
What is next?
I will be back here with an update when that happens. Until then, follow me and let’s stay connected on other social media platforms.
X (Twitter): www.x.com/mademoiselle_RH
Instagram: www.instagram.com/thedatamedic
If you’re interested in learning data analysis, consider checking this MALhub data analysis course out for an interesting and project-based introduction to data analysis.


2 Responses
Heya! I just wanted to ask if you ever have any issues with hackers? My last blog (wordpress) was hacked and I ended up losing many months of hard work due to no back up. Do you have any methods to prevent hackers?
Thank you for reaching out to MALhub!
For further inquiries, feel free to contact us at [email protected] or call +234 816 895 3635.